Crypto Sanctions Flow Analyzer
Total Sanctioned Inflows (2024)
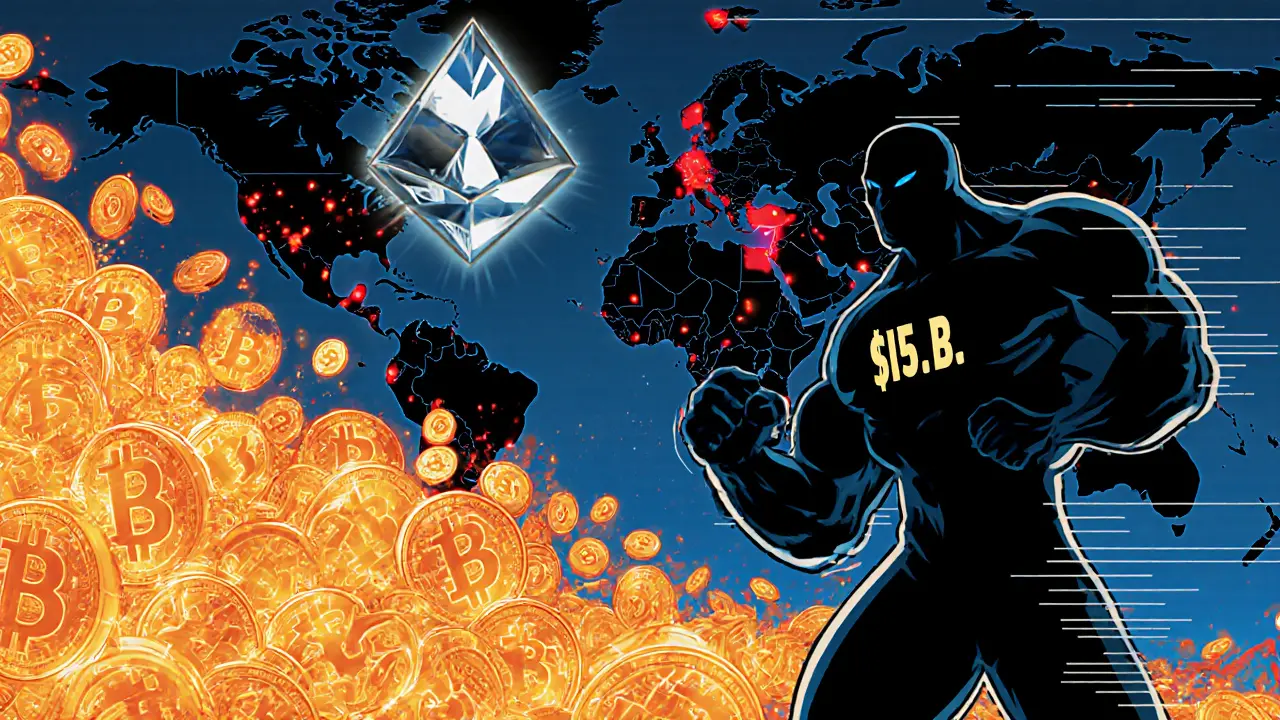
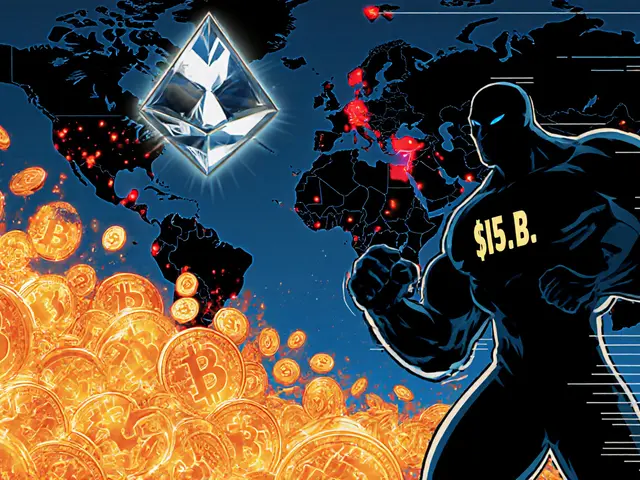
$15.8 billion
Represents 39% of all illicit crypto activity in 2024
Dominant Asset Class
Bitcoin (68%)
Most commonly used for sanctioned transfers
Asset Distribution Analysis
Key Insight
Bitcoin dominates due to its established infrastructure and global recognition.
Top Platforms Handling Inflows
| Platform | Share of Inflows | Description |
|---|---|---|
| Garantex | ~40% | Russian exchange directly sanctioned for ransomware facilitation |
| Nobitex | ~45% | Iranian exchange handling jurisdiction-level inflows |
| Other Platforms | ~15% | DeFi protocols, cross-chain bridges, and other services |
Evasion Techniques Overview
Cross-Chain Bridging
19% of transactions used cross-chain bridges to evade detection.
DeFi Laundering
33% of illicit funds routed through DeFi liquidity pools.
High-Value Wallet Clustering
Over 55% of wallets processed >$500K transactions.
Quick Facts
- Chainalysis reports $15.8billion of crypto inflows to sanctioned entities in 2024.
- This amount equals roughly 39% of all illicit crypto activity for the year.
- Bitcoin makes up 68% of sanctioned‑linked flows, Ethereum 20%, stablecoins the remaining 12%.
- Garantex and Nobitex together handle over 85% of the total inflows.
- DeFi platforms, cross‑chain bridges and high‑value wallets (> $500K) are the fastest‑growing evasion vectors.
$15.8billion in sanctioned entity crypto transactions 2024 represents the total value of cryptocurrency received by entities and jurisdictions under U.S. Office of Foreign Assets Control (OFAC) sanctions during 2024, according to Chainalysis research. The figure marks a watershed moment for digital‑asset enforcement, showing how crypto has become a primary conduit for restricted parties when traditional banking channels tighten.
Why the $15.8B Number Matters
The sheer size of the amount tells three stories at once. First, it confirms that sanctions‑linked actors have moved away from cash and fiat to a borderless, pseudonymous medium. Second, the concentration-nearly two‑thirds of the flow is Bitcoin-shows that even the most established blockchain is still the go‑to choice for high‑value, illicit transfers. Third, the figure highlights the limits of current monitoring tools: while analysts can trace billions, the global crypto volume surpassed $10.6trillion in 2024, making comprehensive oversight a monumental task.
Data Sources and Why They Disagree
Three major blockchain analytics firms publish slightly different numbers:
| Provider | Sanctioned Inflows | Methodology Highlights |
|---|---|---|
| Chainalysis | $15.8B | Includes OFAC‑designated wallets, cross‑chain bridge activity, and DeFi pool interactions. |
| TRM Labs | $14.8B | Focuses on exchange‑level inflows, excludes certain private‑key‑only wallets. |
| CoinLaw.io | $2.7B | Strict definition of “sanctioned entity” - only addresses directly linked to OFAC designations. |
The disparity stems from three factors: (1) how each firm defines a “sanctioned entity,” (2) the breadth of on‑chain data they ingest, and (3) whether they count indirect flows through mixers or bridges. All agree, however, that sanctions‑related activity remains the largest driver of illicit crypto volume in 2024.
Transaction Composition: Coins, Tokens, and Platforms
Breaking down the $15.8B by asset class reveals a clear hierarchy:
- Bitcoin accounts for 68% of the value, making it the dominant vehicle for sanctioned transfers.
- Ethereum holds 20% of the flow, largely because of smart‑contract based DeFi protocols.
- Stablecoins (primarily USDT and USDC) represent the remaining 12%, used to quickly move value into fiat‑compatible tokens.
Cross‑chain bridges were employed in 19% of all transactions, a sign that actors are increasingly hopping between blockchains to confuse analytics tools. DeFi liquidity pools saw 33% of illicit funds routed through them, prompting OFAC to flag 150 pools for facilitating prohibited transfers.
Key Infrastructure: Exchanges and Service Providers
Two exchanges dominate the inflow landscape:
- Garantex a Russian‑based platform that received millions from ransomware payouts and was directly sanctioned by OFAC in 2024.
- Nobitex an Iranian exchange handling a large share of jurisdiction‑level inflows.
Together they process more than 85% of the total sanctioned crypto volume, highlighting a dangerous concentration risk. When regulators crack down on one, the other often absorbs the spill, creating a cat‑and‑mouse dynamic.
Evasion Techniques on the Rise
Sanctioned actors are no longer relying on simple wallet transfers. The 2024 data show three sophisticated tactics:
- Cross‑chain bridging: Moving assets from Bitcoin to less‑monitored chains (e.g., Binance Smart Chain) before cash‑out.
- DeFi laundering: Swapping illicit Bitcoin for privacy‑preserving tokens via automated market makers.
- High‑value wallet clustering: Over 55% of designated wallets processed transactions larger than $500,000, making them attractive targets for mixers that can split the funds into smaller, less‑noticeable parcels.
These methods force enforcement agencies to expand their analytical scope beyond traditional exchange monitoring.
Geographic Hotspots and Crime Types
While OFAC designations cover both entities and jurisdictions, the bulk of the value in 2024 flowed through two regions:
- Iran: Centralized exchanges saw a surge in outflows, reflecting capital flight amid heightened economic pressure.
- Russia: Ransomware payments topped $800M, a 22% increase from 2023, and darknet marketplaces linked to Russian actors moved $1.1B.
Ransomware families like Conti, BlackBasta, LockBit, NetWalker, and Phoenix Cryptolocker all funneled proceeds through Garantex, illustrating the tight coupling between cyber‑crime and sanctioned finance.
Enforcement Actions and Their Impact
2024 saw a spike in targeted sanctions:
- OFAC issued 13 designations that included specific crypto addresses, the second‑highest count in seven years.
- The Treasury Department blacklisted Garantex for facilitating ransomware proceeds.
- 150 DeFi liquidity pools were flagged for allowing sanctioned transactions, pushing many protocols to implement enhanced KYC layers.
- Money launderer Ekaterina Zhdanova exchanged over $2M in Bitcoin for USDT via Garantex after being designated by OFAC.
These actions forced a short‑term dip in inflows for the affected platforms, but the underlying demand for crypto as a sanction‑evasion tool remains robust.
Future Outlook: What to Expect in 2025 and Beyond
Analysts converge on a few key predictions:
- More privacy‑focused coins: Expect increased use of Monero‑like protocols, prompting regulators to consider new legal definitions.
- Advanced cross‑chain bridges: As bridge security improves, they’ll become the preferred tunnel for high‑value transfers.
- International cooperation: Joint task forces between the U.S., EU, and emerging markets will rise, sharing analytics signatures in near real‑time.
- AI‑driven monitoring: Machine‑learning models will flag anomalous patterns faster, but attackers will also employ AI to craft more subtle transaction graphs.
In short, the battle is evolving from a simple “watch‑the‑wallet” approach to a holistic, multi‑layered strategy that spans on‑chain data, off‑chain intelligence, and legal frameworks.

Frequently Asked Questions
How does Chainalysis calculate the $15.8billion figure?
Chainalysis aggregates all transactions that interact with wallets flagged by OFAC, includes cross‑chain bridge hops, and adds flows through DeFi pools that have been manually linked to sanctioned entities. Their model also adjusts for false‑positive filtering based on transaction clustering.
Why do TRM Labs and CoinLaw.io report lower numbers?
TRM Labs limits its scope to exchange‑level inflows, while CoinLaw.io uses a stricter definition that only counts addresses directly cited in OFAC press releases. Both approaches omit indirect or layered transfers that Chainalysis captures.
Can DeFi platforms be held liable for sanctions violations?
In the U.S., the Treasury can designate a DeFi protocol as a facilitation tool, which can lead to secondary sanctions on developers and users. Several pools were already flagged in 2024, forcing them to implement KYC or restrict access for certain addresses.
What role do cross‑chain bridges play in evasion?
Bridges let actors move assets from a monitored chain (like Bitcoin) to a less‑scrutinized one (e.g., Polygon). In 2024, 19% of sanctioned flows used bridges, effectively sidestepping single‑chain analytics.
Will the $15.8billion figure grow in 2025?
Analysts expect a modest rise, driven by broader crypto adoption and the rollout of newer privacy coins. However, tighter sanctions and more AI‑driven monitoring could curb the growth rate.

Dyeshanae Navarro
February 16 2025The $15.8 billion figure really forces us to think about how crypto has become the new lifeline for sanctioned actors. It shows that even the most regulated financial systems are being sidestepped by a borderless technology. The dominance of Bitcoin suggests that anonymity is still a key driver, despite the public ledger. If enforcement agencies can’t keep up, we may see a feedback loop where more illicit actors migrate to crypto. This trend also raises ethical questions about the responsibility of exchanges to monitor flows. In short, the data is a wake‑up call for policymakers worldwide.
Matt Potter
February 18 2025Wow, those numbers are staggering! It’s amazing to see how quickly the crypto world adapts and fills the gaps left by traditional finance. Keep pushing the boundaries, and let’s hope regulators catch up!
Marli Ramos
February 21 2025lol those bridges are like secret tunnels 😂
Christina Lombardi-Somaschini
February 23 2025Dear community, the recent analysis of sanctioned crypto inflows merits a comprehensive reflection; the sheer volume-$15.8 billion-underscores an unsettling reality, namely, that even the most decentralized networks can be co‑opted for nefarious purposes. Moreover, the concentration of activity on platforms such as Garantex and Nobitex suggests a systemic vulnerability, which, if left unaddressed, may exacerbate geopolitical tensions. Consequently, we must advocate for collaborative international frameworks, enhanced transparency protocols, and robust compliance mechanisms; only then can we hope to mitigate the misuse of digital assets.
katie sears
February 25 2025Indeed, the regional focus on Iran and Russia amplifies the risk profile; it also illustrates how sanctions can inadvertently channel funds into specific jurisdictions, thereby creating unintended economic pressures.
Gaurav Joshi
February 28 2025It is morally indefensible that platforms profit from sanctioned money and ignore their duty to society.
Kathryn Moore
March 2 2025Most of the flow is just Bitcoin moving through a few exchanges.
Christine Wray
March 4 2025The data paints a clear picture of concentration, yet it also highlights the resilience of DeFi protocols in adapting to regulatory pressures.
roshan nair
March 7 2025From a technical perspective, cross‑chain bridges are a double‑edged sword – they enable liquidity but also create blind spots; analysts need to develop heuristics that can track token migrations across heterogeneous ledgers.
Jay K
March 9 2025I concur with the observations presented; the emphasis on high‑value wallet clustering warrants further statistical scrutiny.
Kimberly M
March 11 2025Great breakdown! 👍 The numbers really help us grasp the scale of the problem. 🌐
Navneet kaur
March 14 2025You really need to stop ignoring the moral decay caused by these platforms, they are breeding grounds for criminal activity.
Marketta Hawkins
March 16 2025Anyone who thinks this is just a blip is clueless – the crypto underworld is getting stronger every day.
Drizzy Drake
March 18 2025Reading through the report, I felt a mix of awe and concern about the sheer magnitude of sanctioned crypto flows in 2024.
The fact that Bitcoin alone accounts for 68 percent of the total underscores its entrenched position as the go‑to asset for illicit actors.
Yet, what really stands out to me is the rapid adoption of cross‑chain bridges, which now facilitate nearly one‑fifth of all sanctioned transactions.
These bridges essentially act as hidden corridors, allowing funds to slip between networks unnoticed.
From an enforcement standpoint, that creates a nightmare scenario where traditional tracking tools lose visibility.
On the flip side, DeFi liquidity pools have become massive laundering hubs, absorbing a third of the illicit value.
The community’s push for anonymity tokens only accelerates this trend, making future analysis even tougher.
Regulators are scrambling to keep up, but the pace of innovation in the crypto space far outstrips legislative processes.
International cooperation could be a game‑changer, yet geopolitical frictions often stall joint efforts.
Moreover, the concentration of inflows on Garantex and Nobitex highlights a dangerous reliance on a few gatekeepers.
When those exchanges face sanctions, the market simply shifts to the next compliant venue.
That cat‑and‑mouse dynamic perpetuates a cycle of evasion that harms both the financial system and ordinary users.
We also need to consider the human element – the victims of ransomware whose data is weaponized for profit.
In the end, a multi‑layered approach blending on‑chain analytics, off‑chain intelligence, and legal tools seems essential.
Only through sustained collaboration can we hope to diminish the appeal of crypto as a sandbox for sanctioned entities.
AJAY KUMAR
March 21 2025The rise of privacy coins is the ultimate rebellion against any form of oversight; it’s a bold statement that freedom cannot be caged.
bob newman
March 23 2025Sure, the numbers are accurate-if you trust the shadowy agencies that decide what gets counted and what gets ignored.
Anil Paudyal
March 25 2025Analytics must evolve fast to catch bridge hops.
Kimberly Gilliam
March 27 2025Another report, another reminder that crypto crime never sleeps.
lalit g
March 30 2025We should foster open dialogue among stakeholders to develop solutions that respect both security and innovation.
Reid Priddy
April 1 2025While everyone praises AI‑driven monitoring, we must remain skeptical of overreliance on algorithms that can be gamed.
Shamalama Dee
April 3 2025Thanks for sharing this deep dive; it’s a valuable resource for anyone looking to understand the complexities of sanctioned crypto flows.