When you look at a Bitcoin price chart, you’re seeing the result of millions of transactions-each one recorded forever on a public ledger. But what if you could see who is buying, when they’re selling, and why the market is moving-not just the price itself? That’s what on-chain analysis does. It’s not about guessing trends from candlesticks. It’s about reading the actual digital footprints left by real people and institutions moving cryptocurrency across the blockchain.
What Exactly Is On-Chain Analysis?
On-chain analysis is the process of examining public blockchain data to understand how cryptocurrency is being used. Every Bitcoin, Ethereum, or Solana transaction is permanently stored on its network. These records include wallet addresses, amounts sent, timestamps, and even which smart contracts were triggered. No one’s name appears-just strings of letters and numbers. But skilled analysts can connect those dots to reveal patterns: Are whales moving coins to exchanges? Are long-term holders dumping? Is new money flooding in?
This isn’t new. The first metric, Coin Days Destroyed, was created back in 2011 to measure how long coins had been sitting idle before being moved. Today, it’s a multi-billion-dollar industry. Tools like Glassnode, Nansen, and Arkham Intelligence process over 2.5 million transactions per minute across major blockchains. They turn raw data into clear signals that professional traders rely on.
Key On-Chain Metrics You Need to Know
Not all data is useful. The best on-chain metrics focus on behavior, not just volume. Here are the five most important ones:
- Active Addresses: Counts how many unique wallets sent or received crypto in a day. Rising numbers mean more people are using the network. A sudden drop can signal loss of interest.
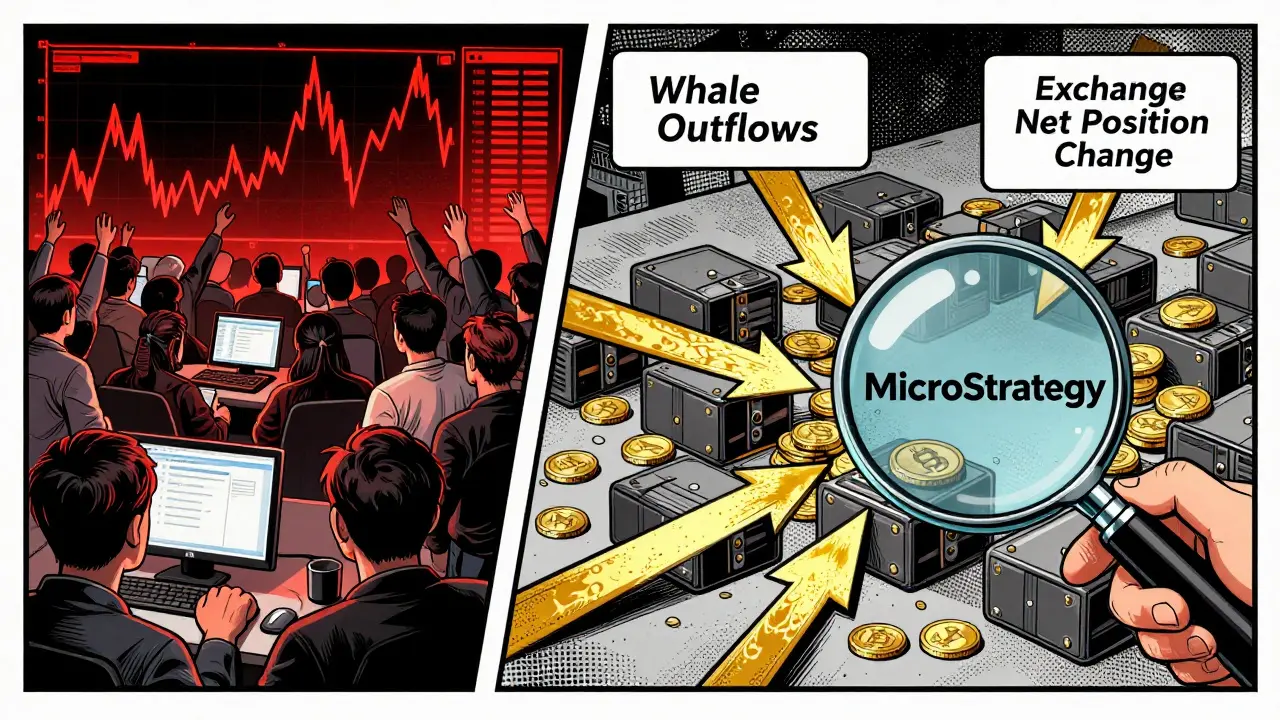
- Exchange Net Position Change: Tracks how much crypto is flowing into or out of centralized exchanges like Coinbase or Binance. When large amounts leave exchanges, it often means people are moving to private wallets-usually a sign of confidence. When they flood in, it often means people are preparing to sell.
- Spent Output Profit Ratio (SOPR): Measures whether coins are being sold at a profit or a loss. If SOPR is above 1.0, most coins sold were bought at a lower price. Below 1.0 means people are selling at a loss. This helps spot panic selling or profit-taking.
- Network Value to Transactions (NVT) Ratio: Like the P/E ratio in stocks. It divides the total market value of a cryptocurrency by its daily transaction volume. A high NVT (above 100 for Bitcoin) suggests the price might be inflated relative to actual usage.
- MVRV Ratio (Market Value to Realized Value): Compares current market price to the average price all coins were last moved. When MVRV is high, it often signals a market top. When it’s low, it can mean a bottom is near.
These aren’t magic bullets. But used together, they paint a much clearer picture than price charts alone.
How It Beats Technical Analysis
Most retail traders rely on technical analysis-chart patterns, moving averages, RSI. But here’s the problem: TA only looks at price and volume. It can’t tell you if the buyers are real investors or bots. It can’t tell you if a price spike is fueled by whale accumulation or fake volume.
On-chain analysis answers those questions. For example, during the 2021 Bitcoin rally, Glassnode showed that the MVRV ratio hit 3.8-historically a level that preceded major corrections. Around the same time, exchange outflows hit record highs. That meant people weren’t selling-they were holding. When the crash came months later, many TA-only traders were caught off guard because their charts still showed bullish patterns.
Studies show combining on-chain data with technical analysis improves prediction accuracy from 55% to over 70%. That’s not a small edge. That’s the difference between guessing and having a strategy.
Real-World Examples: What It Looks Like in Action
On Reddit, a user named ChainSleuth89 noticed 125,000 ETH leaving Coinbase over three days in early 2024. That’s a massive outflow. They held off on buying, and two days later, Ethereum dropped 37%. The outflow wasn’t panic-it was institutional accumulation. But the user didn’t know that yet. They just saw movement away from exchanges, and acted on it.
Another trader, WhaleWatcher2023, tracked wallets holding 100-1,000 BTC. Over six weeks, those wallets accumulated 285,000 BTC. That’s not random. It’s coordinated. A few weeks later, Bitcoin rallied 40%. The market didn’t move because of news-it moved because big players were quietly buying.
But it’s not always perfect. In late 2023, Arkham Intelligence recorded a spike in exchange inflows. Many traders assumed it was a bearish signal. But it turned out to be institutions using OTC desks to buy Bitcoin without triggering public exchange data. The inflow was fake-because the real buying happened off-chain. That’s why context matters. One metric alone can mislead.
Tools You Can Use (Free and Paid)
You don’t need a hedge fund budget to start. Here’s how to begin:
- Free: Use Etherscan for Ethereum or Blockstream Explorer for Bitcoin. They show raw transaction data. Not pretty, but it’s real.
- Entry-Level Paid: Glassnode’s Essentials plan ($79/month) gives you access to 15+ core metrics with clean charts. Nansen’s Starter plan ($99/month) adds wallet labeling-so you can see if a wallet belongs to a known entity like MicroStrategy or Binance.
- Advanced: Arkham Intelligence ($149/month) labels over 150 million wallets across 12 blockchains. It can tell you if a transaction came from a DeFi protocol, a miner, or a known exchange.
Most users start with free tools. Then, once they understand the metrics, they upgrade. The learning curve isn’t steep-just time-consuming. Broscorp estimates 60-80 hours of study to get comfortable with the core 15 metrics.
Limitations and Risks
On-chain analysis isn’t perfect. Here’s what it can’t do:
- Can’t see off-chain activity: About 15-20% of crypto activity happens outside the blockchain-like OTC trades, private transfers, or wrapped tokens. That data is invisible.
- False signals happen: During holidays or low-volume periods, small trades can look like big moves. A single whale moving 500 BTC might look like a trend, but it’s just one person.
- Not for beginners: Dr. Carol Alexander from the University of Sussex warns that retail investors often mistake noise for signals. SOPR dropping to 0.95? That’s not necessarily a crash signal. It might just be normal profit-taking.
And yes, some platforms are expensive. Nansen has a 2.8/5 rating on Trustpilot, with users complaining about the $99/month price. Glassnode’s free tier only shows 30 days of data-enough to play around, not enough to make serious decisions.
Who Uses It-and Why
Professional traders? They use it daily. A 2024 CryptoCompare survey found 92% of institutional crypto investors rely on on-chain data. That’s up from 68% in 2020.
Here’s how different groups use it:
- Institutions: Use it for risk management. They track exchange reserves to avoid being caught in a liquidity crunch.
- Retail traders: Use it to time entries and exits. They watch for whale movements and exchange outflows to avoid crashes.
- Media and researchers: Use it to verify claims. If a project says “10,000 active users,” on-chain data can prove or disprove it.
Even regulators are paying attention. The SEC acknowledged in February 2024 that on-chain data is a “legitimate source of market intelligence.” That’s a big deal-it means this isn’t just trader chatter. It’s becoming part of the financial infrastructure.
The Future of On-Chain Analysis
The field is evolving fast. In 2024, Glassnode launched Realized Cap HODL Waves, which shows how long coins have been held-down to the day. Nansen’s AI platform now predicts price movements with 68% accuracy over 24 hours by analyzing 50+ metrics. Arkham labeled over 150 million wallets, cutting down the “unknown address” problem that used to muddy analysis.
Next up? Cross-chain tracking. Chainalysis bought PolyScope in September 2024 to follow assets moving between Bitcoin, Ethereum, Solana, and 17 other chains. By 2026, analysts predict on-chain tools will combine off-chain data-like derivatives positions and order books-to create a full market view. That could push prediction accuracy above 80%.
But the core idea won’t change: the blockchain tells the truth. You just have to know how to read it.
How to Get Started Today
You don’t need to be a coder or a mathematician. Here’s a simple plan:
- Go to Etherscan.io or Blockstream.info and look at a few recent transactions. See how they’re structured.
- Visit Glassnode’s free dashboard. Watch the Exchange Net Position Change for Bitcoin over the last week. Is money flowing in or out?
- Read one metric explanation per day. Start with SOPR and Active Addresses.
- Join r/OnChainAnalysis on Reddit. There are 48,000 members. They post weekly deep dives on metrics like Puell Multiple and MVRV Z-Score.
- After a month, try applying one signal to your trading. Don’t overthink it. Just test one thing.
On-chain analysis isn’t about predicting the future. It’s about understanding what’s already happened-and using that to make smarter choices today.
Rishav Ranjan
December 22 2025This is just chart-worship with extra steps.
Naman Modi
December 23 2025Whales don't care about your metrics. They move when they want. You're just noise.
Zavier McGuire
December 24 2025I've been trading since 2017 and I still just use TA because it works better than this overcomplicated garbage
Shubham Singh
December 24 2025A fascinating exercise in self-deception. One must wonder whether the 92% of institutions using on-chain data are truly discerning, or merely following the herd with more sophisticated tools.
Ashley Lewis
December 26 2025If you need a $99/month dashboard to understand crypto, you shouldn't be investing.
Sheila Ayu
December 28 2025I love how people treat blockchain data like it's sacred scripture... when 80% of it is washed through mixers, fake volume, and shell wallets! You're all just reading tea leaves made of SHA-256!
Sarah Glaser
December 30 2025The blockchain is a mirror. It reflects intent. But intention requires context. A wallet moving coins out of an exchange doesn't mean 'confidence'-it could mean they're preparing for a private sale, or a tax event, or simply moving to cold storage after a long holding period. The data doesn't lie-but humans always interpret it with bias.
Dustin Bright
December 31 2025I just started reading this and I’m already hooked 😍 I used to think TA was everything… now I’m checking Etherscan every morning like it’s my daily horoscope 📊✨
vaibhav pushilkar
December 31 2025Start with Glassnode free tier. Watch exchange outflows for a week. Then compare it to price action. You'll be surprised how often they lead.
Steve B
January 2 2026The notion that blockchain data reveals truth is a colonial fantasy. Who gets to label wallets? Who decides what 'whale' means? This is surveillance dressed as analysis.
Jacob Lawrenson
January 3 2026YESSSSSS! This is the real deal 🚀 I used to lose money guessing... now I check SOPR before I buy. Game changer!!
Cathy Bounchareune
January 5 2026I love how this post doesn't mention that on-chain analysis is basically the same as forensic accounting... just with more emojis and fewer auditors. It's beautiful, really. The ledger doesn't forget. And that’s the most human thing about crypto-every move leaves a trace.
Charles Freitas
January 5 2026Oh look, another person who thinks reading numbers makes them smarter than the 95% of traders who lost money last year. Congrats, you’ve upgraded from gambling to data-worship. Still gambling. Still wrong. Still rich? No? Then why are you here?
Helen Pieracacos
January 6 2026You say 'the blockchain tells the truth'... but what if the truth is that most wallets are owned by bots, exchanges, or people who don't even know what a private key is? You're not reading the blockchain-you're reading a ghost story written by marketers.
Sybille Wernheim
January 8 2026This is actually really well explained!! I used to think crypto was just hype... but now I’m checking active addresses every morning like it’s my coffee schedule ☕️🔥
Lloyd Yang
January 9 2026Let me tell you something-on-chain analysis isn’t about predicting the future. It’s about seeing the past with clarity. Like watching a crime scene replay in slow motion. You see the footprints, the broken glass, the fingerprints smudged by haste. You don’t know who did it… but you know how they moved. And that’s enough to keep you alive when the cops show up. That’s what this is. Not prophecy. Survival.
Craig Fraser
January 9 2026The irony is thick here. People pay hundreds for tools to 'decode' blockchain data… while ignoring the fact that the blockchain was built to be transparent. The real insight? Stop overcomplicating it. If you need 15 metrics to trade, you’re not a trader-you’re a data analyst with a gambling problem.
SHEFFIN ANTONY
January 10 2026I’ve been doing this since 2016. I used to think Nansen was magic. Then I realized half their wallet labels are wrong. Then I realized even the 'whales' are just hedge funds pretending to be anarchists. The blockchain doesn't lie-but the people selling you the tools? Oh boy, do they lie.
Jordan Renaud
January 11 2026The author is the post. This is a sponsored piece disguised as education. No one writes this well unless they're being paid by Glassnode.